In today’s data-driven world, understanding macro-scale phenomena often begins with data analysis. Two key tools in this field are:
• Curve fitting, such as linear regression, which minimizes the least squares error
• Fourier transform, which decomposes signals into frequency components—particularly useful in analyzing periodic systems
In this project, I generate a synthesized signal made up of multiple sine waves, apply simple mathematical operations, and analyze the result using Fourier transform. Surprisingly, these operations behave like digital filters in the frequency domain.
🔗 See more details here.
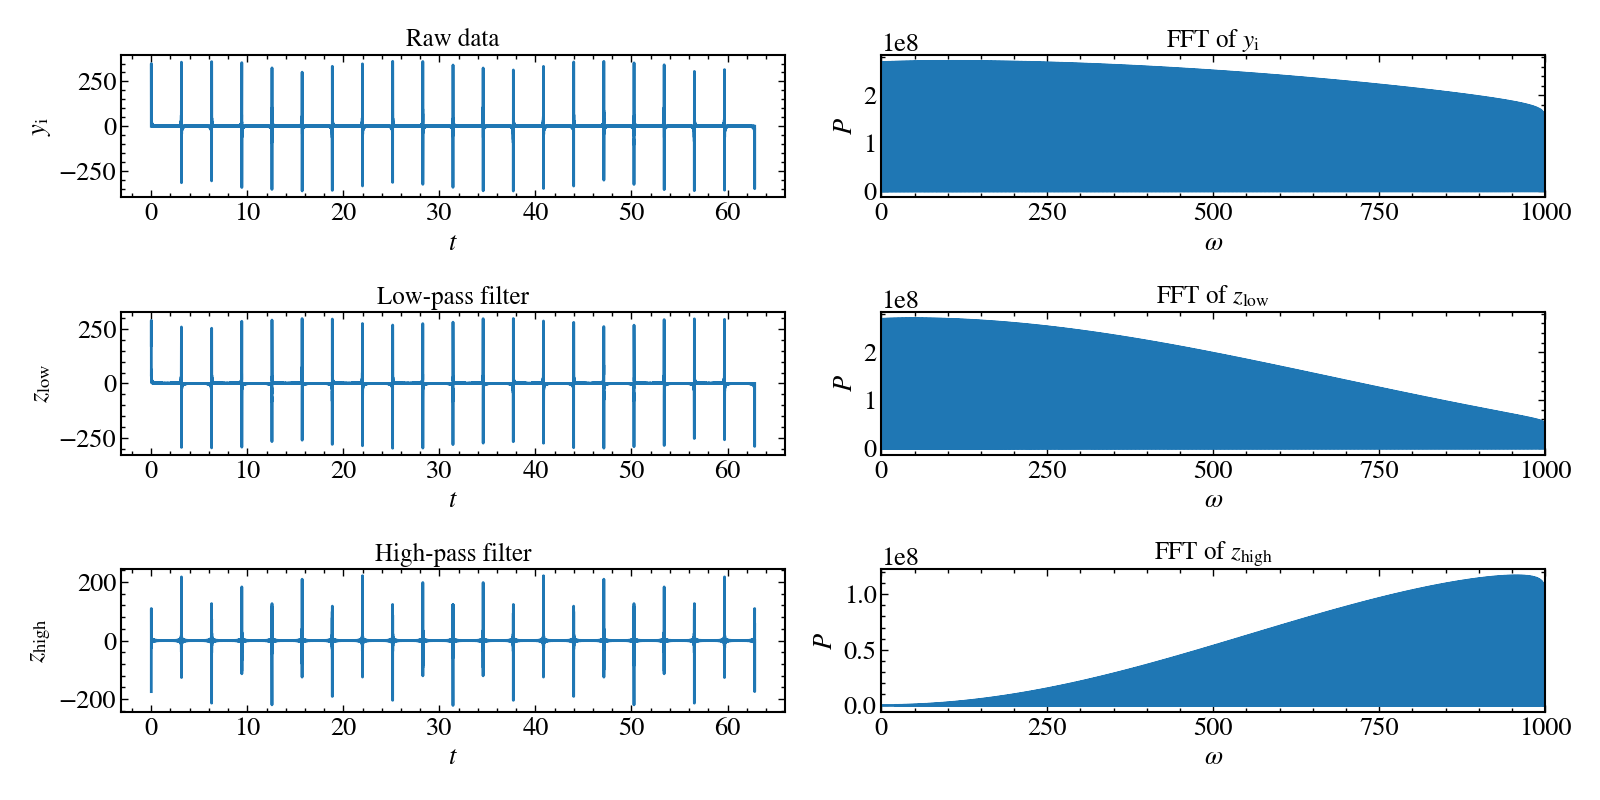
Original Data Generation
The synthetic data is a superposition of many sine waves with increasing frequency by $$ t_i = \frac{20(i-1)\pi}{N-1}, y_i = \Sigma_{j=1}^{999} {sin(jt_i)} $$
with various frequencies sine wave, where \(j\) is odd and \(y_{N+1} = y_1\).
Filter Equation
We apply two simple operations on the data to act as digital filters:
• Low-pass filter $$ z_{low} = \frac{1}{2}(y_k+y_{k+1}) $$ • High-pass filter: $$ z_{high} = \frac{1}{2}(y_k-y_{k+1}) $$ These operations are applied element-wise to the signal and analyzed using Fast Fourier Transform (FFT).
Analysis Result
Below is the spectrum showing the original and filtered data: